

Atlas Program Images
Four Creeks Unincorporated Area Council
The Atlas Warehouse
The Atlas Warehouse page is being updated to provide a dynamic indexing capability
The Atlas Warehouse contains the images (i.e. the maps) and other files (e.g. tables, documents, databases) produced for the program.
Some images are sized for 11x17 paper and set for high quality print (large data files). As things progress the program will address the challenge of maps available in different dimensions.
Organization
The artifacts are generally maintained in alphanumeric order although, in some cases, similar images are grouped together for ease of reference.
Other views
Other Atlas web pages extract the basemaps, themes (layers), and areas.artifacts from the warehouse.
Contents
Map inventory (e.g. a full list of maps archived or available.
Source data
Catalog (e.g. a full list of potential source data including King County's entire Spatial Data Catalog).
colLeft
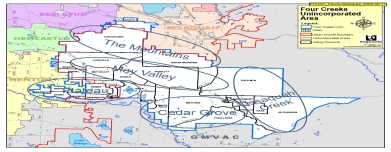
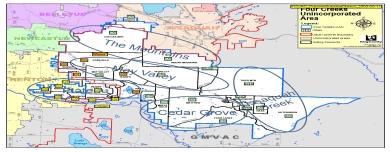
These 3 images (Fig_1, Fig_2, and Fig_3) were used to select a legend box. The preliminary decision was to make it smaller and put it along the right edge of the page (see other sample images). Recently there's been a request (granted) to put the Green River CC logo in the legend.
Note that they also contain the 2004 King County map for reference. You can tell that year's map by the shape of the east boundary of the Tiger Mtn. and Hutchinson precincts. The curved line was in error in 2004.
??Should the legend be left where it is, moved, or made an overlay of the image (i.e. maximize the viewing window)??
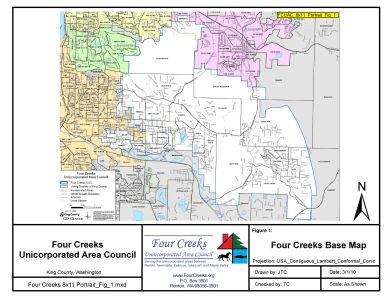
FCUAC_8x11_Portrait_Fig_1
This working chart is one of 3 (Fig_1b, Fig 1c) that were used to decide on the icon and information layout (at the bottom).
Ultimately Fig_1c was closest to where it ended up. On the final products the information was move to the right edge of the page.
There's some thinking that the information should be made even smaller and placed inside the displayed map area. This would mean that centering of areas would be to the page not the visible window which would allow for more information.
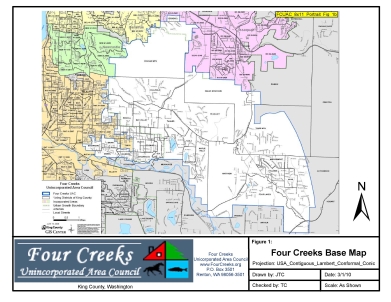
FCUAC_8x11_Portrait_Fig_1b
See FCUAC_8x11_Portrait_Fig 1
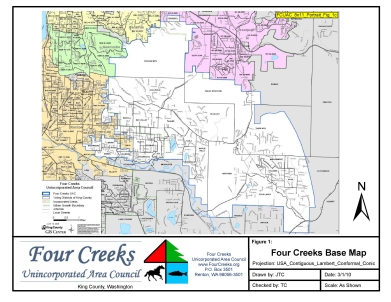
FCUAC_8x11_Portrait_Fig_1c
See FCUAC_8x11_Portrait_Fig 1
These maps are also based on the 2004 King County map. They include the precinct map with markups for subareas and districts.
They're only value is the subarea notional markup.
FCUAC_Precinct_2009-07-11
Check because the original gets distorted.
FCUAC_PrecinctSubarea_2009_09_11
King County map with subareas. Check because the original gets distorted.
FCUAC_PrecinctSubareaDistrict_2009-09-11
KC Map with subareas and districts. Check because original map is distorted.
A chart showing place names
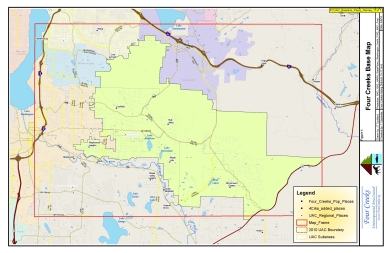
FCUAC_Baseline_Place_Names_11x17
This working chart displays "place names" in the UAC area. The data is included on later maps with a reformatting of the names to make them a bit easier to see and read.
What's seen are areas like Hi Valley, Maplewood Heights, Coalfield, Maple Hills and Mirromount Estates.
The preliminary decision was that these were good for orientation and therefore part of base maps.
You'll see these names on later charts formatted differently.
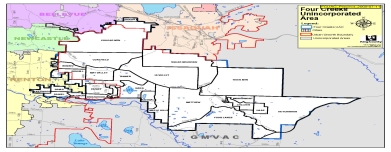
These next charts were produced to resolve differences between the UAC boundary as defined by a list of voting precincts and one defined by the Four Creeks UAC boundary in King County GIS.
Note that the lower map (King County 2009) has been updated to correct the boundary issue with Tiger Mtn and Hutchenson precincts seen on the King County 2004 map.

FCUAC_Boundaries
Using a King County UAC map (bottom) the UAC boundary defined in the KC GIS database is compared to the boundary created by the list of voting precincts.
Note areas (e;g; lower right) where the boundaries don't match. This means the KC UAC boundary will need to be updated.

FCUAC_Boundary_comparison_11x17_portrait
Using a King County UAC map (bottom) the UAC boundary defined in the KC GIS database is compared to the boundary created by the list of voting precincts.
Note areas (e;g; lower right) where the boundaries don't match. This means the KC UAC boundary will need to be updated.

FCUAC_Boundary_overlay_11x17_portrait-revised-vote-districts
These working charts display the UAC boundaries. The top map compares the area that is the sum of the boundaries of the FCUAC voting precincts with the King County FCUAC boundary layered on top. The markup shows a few places where it appears there may be a mismatch.
The conclusion is that the FCUAC boundary defined in the King County GIS needs to be updated.
The lower chart is the 2009 King County chart with some markup for UAC subareas and districts.
This is an interesting layout for things like boundaries where an individual map may not be necessary.

FCUAC_Boundary_Maps_11x17
This 2x3 template is a good base for summarizing boundaries whether or not a full size image is included in the atlas. Good candidates include the Legislative Districts, KC Council Districts, KC Court Districts, along with Congressional Districts and other high-level boundaries.
This chart is simply used to define the data area used to limit large GIS data files. It only needs to be reviewed if additional data from large databases is needed.

FCUAC_Data_Frame_11x17
This working chart is used to set the frame for large data files. When including massive data it's important to filter out much of the unneeded data. This chart shows the frame for that data.
The term "base map" has meaning in mapping. Think of them as the background for an image. They are the things that will be there for all charts that use them.
There a quite a few base map samples. The direction given is to take all shading (regardless of color) from the UAC area so that it's as transparent as possible which means detail will be more visible.

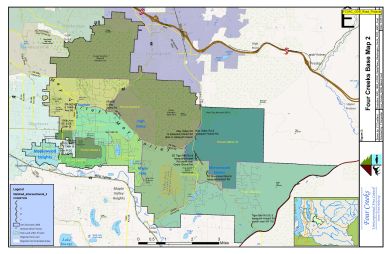
FCUAC_GDB_Base1
This chart is one of a number of "base" map samples. Base maps, once decided, allow other layers on top.
In this case the experiment was with hill shading.

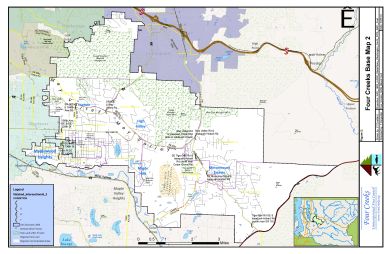
FCUAC_GDB_Base2
Another "base" map sample.

FCUAC_GDB_Base3
Another "base" sample

FCUAC_GDB_Base3b
Another "base" sample

FCUAC_GDB_Base3c
Another "base" sample

FCUAC_GDB_Base4
Another "base" sample

FCUAC_GDB_Base5
Another "base" sample
The first aerial map of the UAC
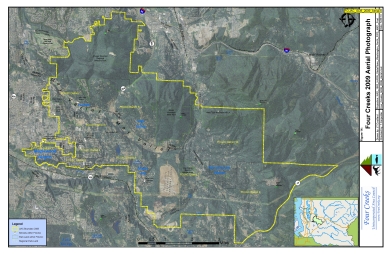
FCUAC_GDB_2009_Aerial3
UAC boundaries overlaying a 2009 aerial photo.
A map of the metro routes
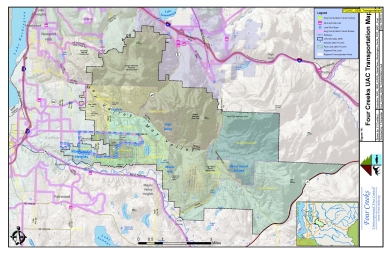
FCUAC_GDB_Transportation
A map showing the metro transportation routes and stops. Note that the UAC was shifted right in the window to allow for more of the metro routes to be shown. Need to move it back or produce a special "area" to include more of the surrounding places.
An overlay of road intersections, segments, etc.
FCUAC_GDB_Road_Projects
A map showing the location of some road intersections. This is based on a table used by FCUAC to communicate with KC DOT Roads.
An overlay of road intersections, segments, etc. with different base
FCUAC_GDB_Road_Projects2
Same as FCUAC_GDB_Road_Projects but with a different base.
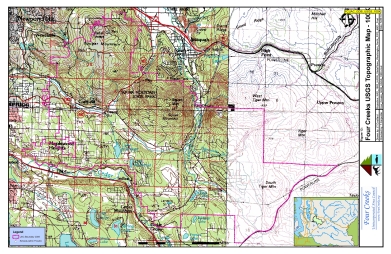
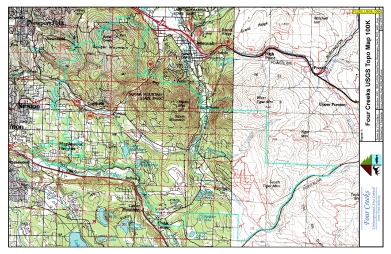
FCUAC_GDB_USGS_100k
USGS 100k sample

FCUAC_GDB_USGS_1x2
USGS 1x2 sample

FCUAC_GDB_Vegetation
UAC Area; forest cover
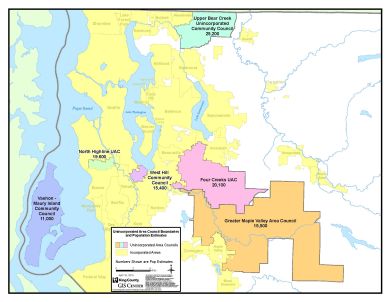
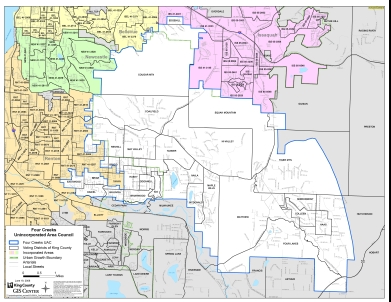
FCUAC_KC_UACs
King County Unincorporated Area Councils. The boundaries will need to be updated when FCUAC completes its precinct update. Because the FCUAC area is defined by a list of voting precincts, annual changes done by King County Elections can change to FCUAC borders
FCUAC_KCCD
King County Council Districts
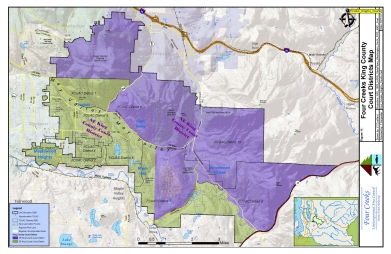
FCUAC_KingCo_Courts
King County Court Districts
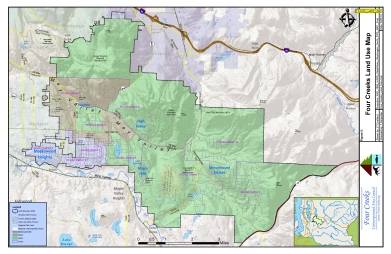
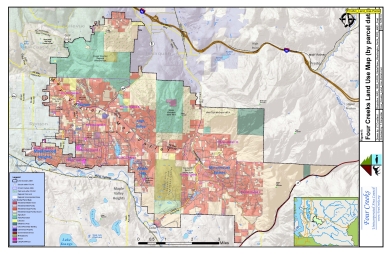
FCUAC_Land_Use
Land use from a FCUAC table. That table identifies Districts as all urban, all rural or mixed.
This is not a very useful piece of information and would be better displayed at the precinct level with the Urban Growth Boundary on the map.
FCUAC_Land_Use-Parcel
Picks a number of land use designations and maps to the parcel. This map should be updated to use the King County Comprehensive Plan land use categories.
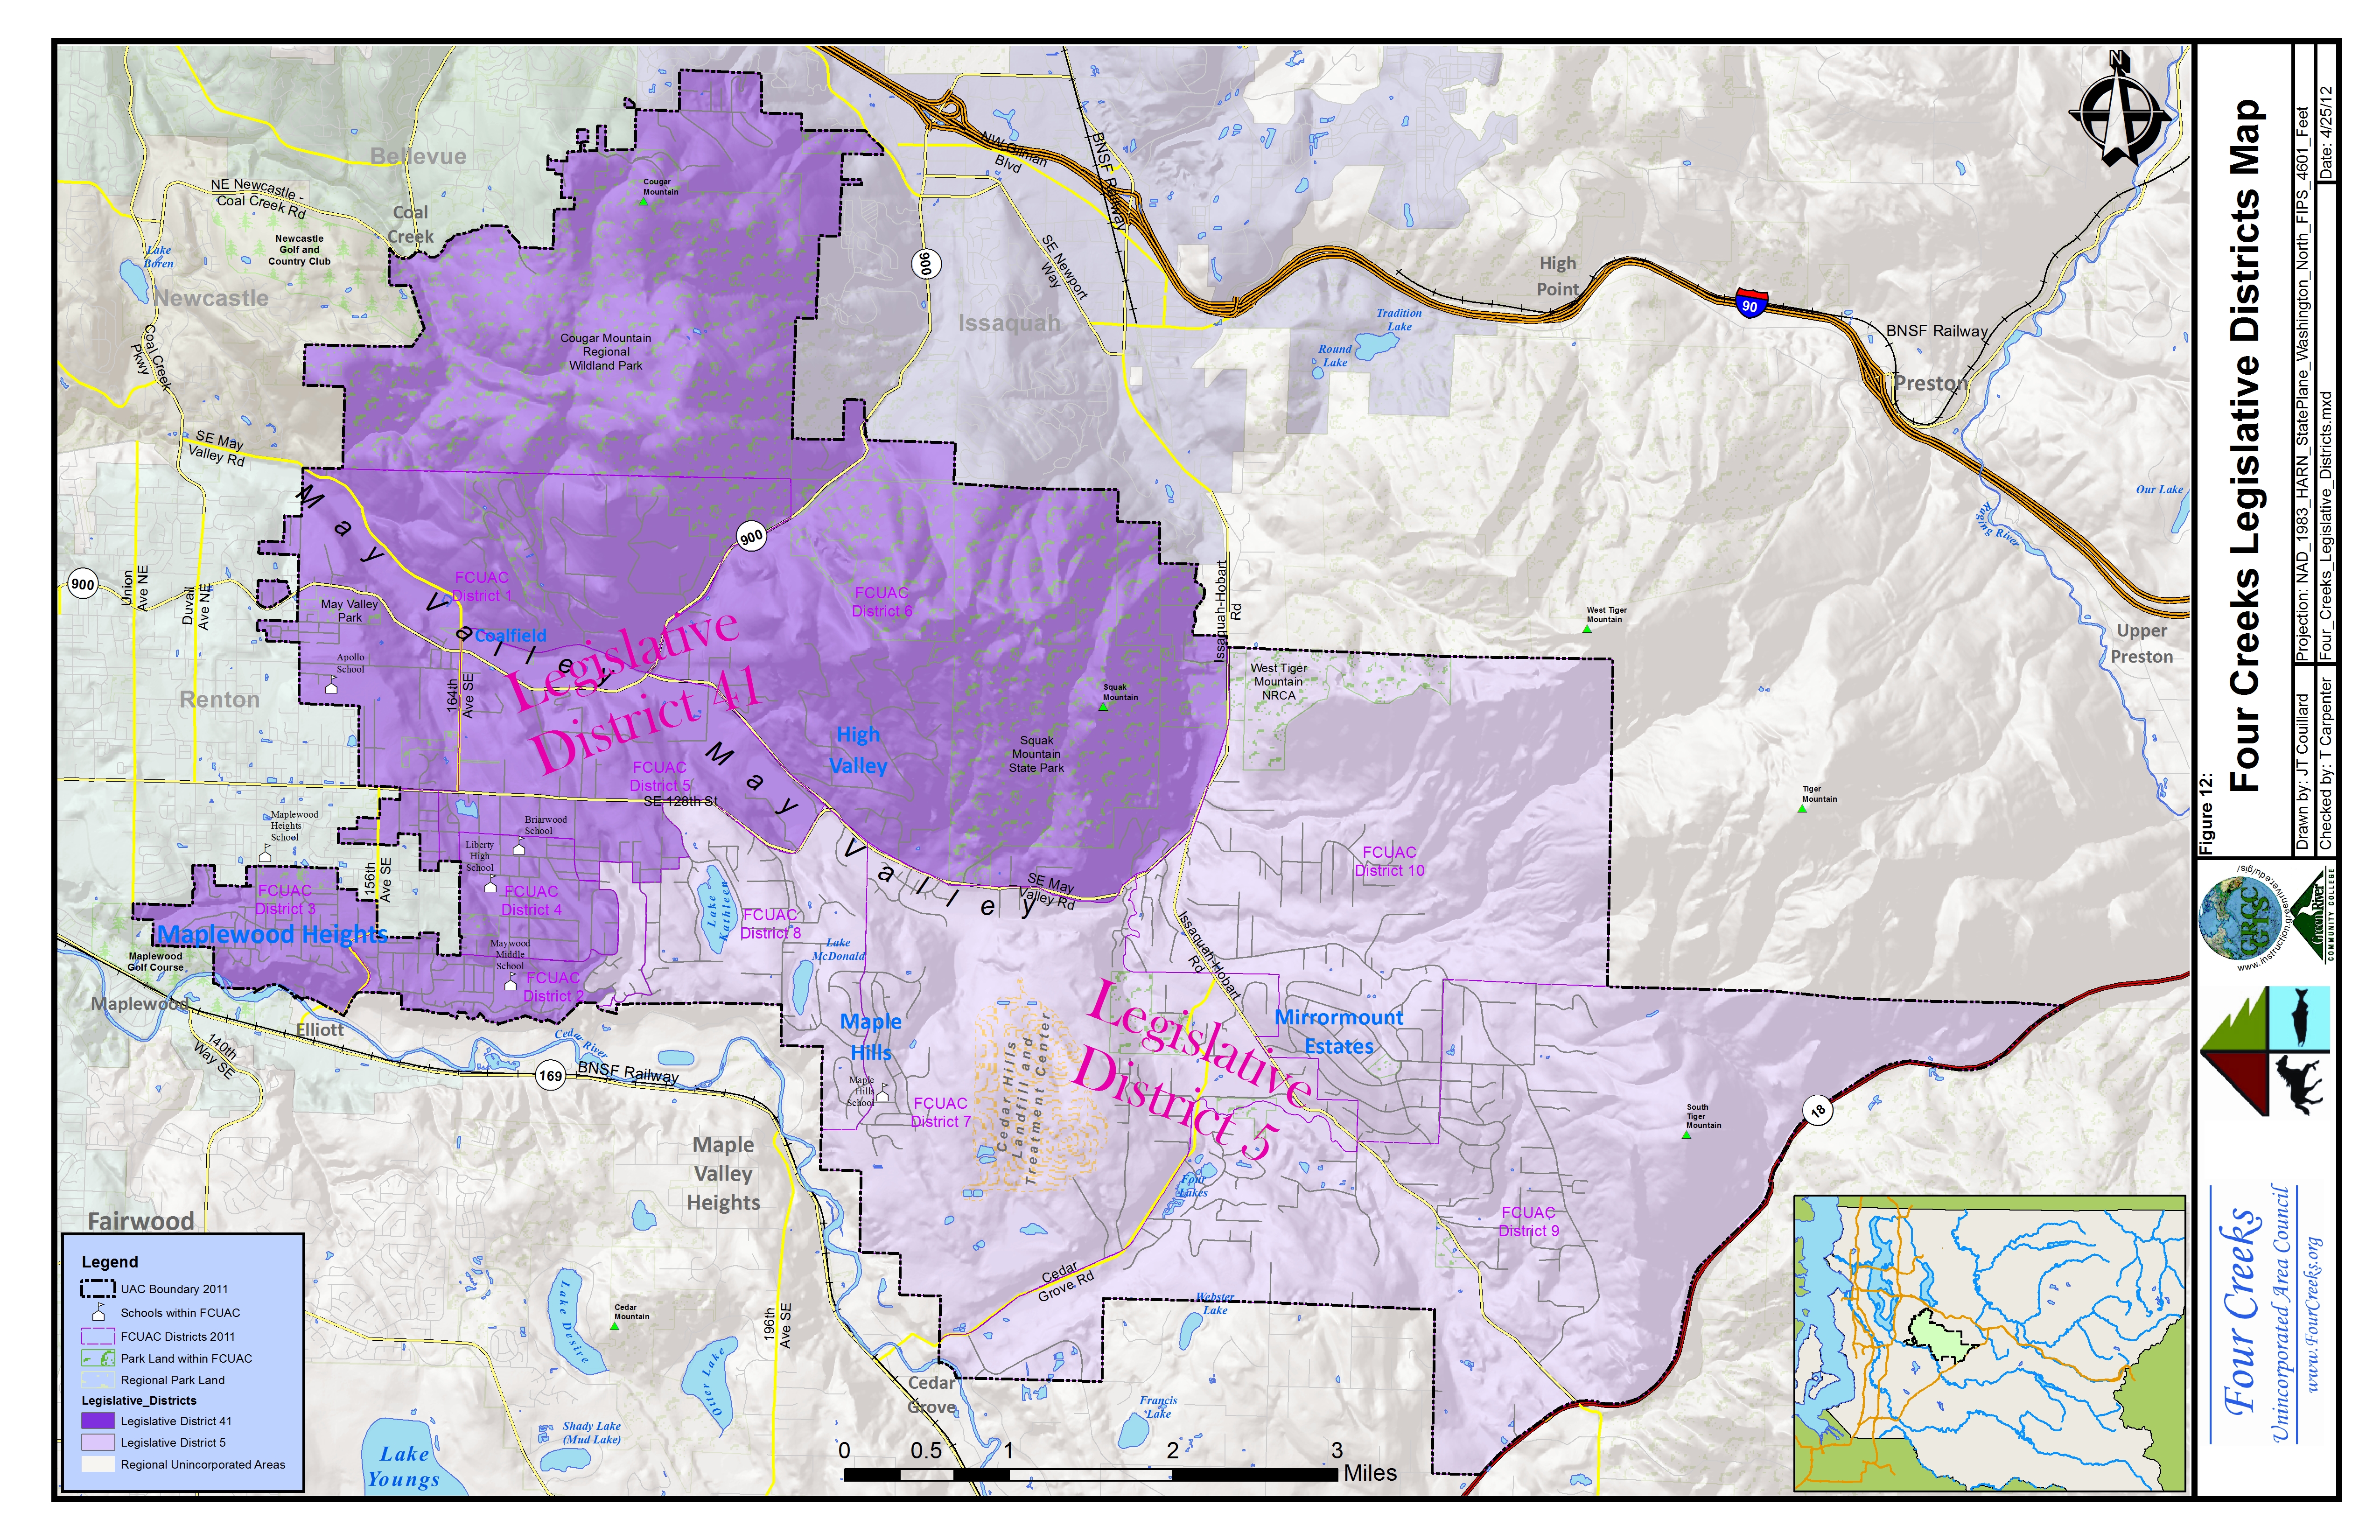
FCUAC_Legislative_Districts
Washington State legislative districts.
This is the first "subarea" map sample. In this case it's the May Valley subarea.
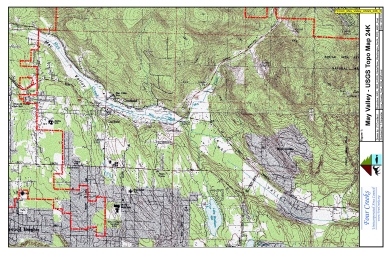
FCUAC_May_Valley_USGS_24K_3
USGS map of May Valley
FCUAC_Precinct_2008-06-19
King County produced UAC precinct map. Used as a reference.

FCUAC_Test_GDB_basemap-green
A basemap sample

FCUAC_Test_GDB_basemap-white
Base map sample

FCUAC_Test_GDB_basemap-white_alternate
????

FCUAC_Test_GDB_basemap-white_alternate_relief
A base map sample

FCUAC_Test_GDB_basemap-white_deleted_hatch
Basemap sample

FCUAC_Test_GDB_basemap-white_relief2
????

FCUAC_Test_GDB_Forest_Cover2
Forest cover

FCUAC_Test_GDB_LandUse1
????

FCUAC_Test_GDB_LandUse2
????

FCUAC_Test_GDB_LandUse3
????

FCUAC_Test_GDB_Parcels
????

FCUAC_Test_GDB_Subareas
?????

FCUAC_Test_GDB_Subareas_relief2
?????

FCUAC_Test_GDB_Transportation
????

FCUAC_Test_GDB_Voting_Districts
FCUAC voting precincts

FCUAC_Test_GDB_Voting_Districts-5-1-10
????

FCUAC_Test_GDB_Voting_Districts-white
FCUAC voting districts

FCUAC_Test_GDB_WIP
????

FCUAC_Test_GDB_WIP_hillshade
?????

FCUAC_Test_GDB_WIP_T291
?????

FCUAC_Test_GDB_WIP2
????
FCUAC_USGS_100K
????
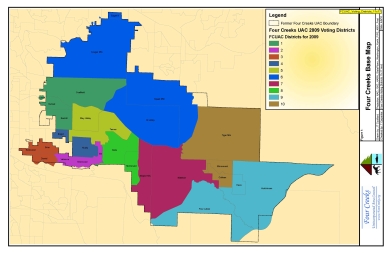
FCUAC_Voting_Districts_11x17
FCUAC Districts
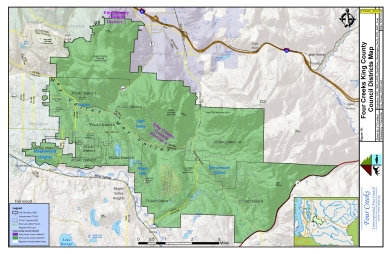
District 7. The main areas for the UAC are: the UAC, the Districts, and the Subareas. These images are samples of a district map (using district 7).
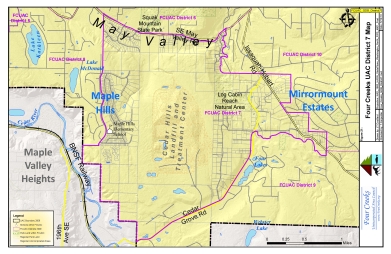
FCUAC_GDB_District7
District 7 sample
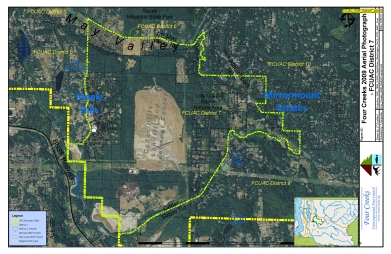
FCUAC_GDB_District7-aerial
District 7 sample
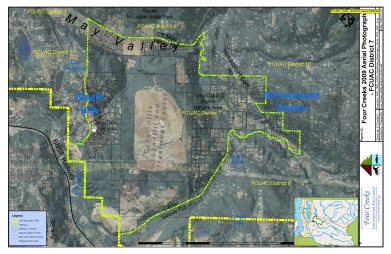
FCUAC_GDB_District7-aerial-hillshade
District 7 sample
Combined FCUAC and GRCC legend
colRight